htop 最佳实践
2024/1/21...大约 9 分钟
安装
下载的话就不多说了,常见的系统基本都可以直接使用包管理器直接安装,以Debian 为例
apt update
apt install htop -y
其他系统参考官方文档 【官方地址】
分区
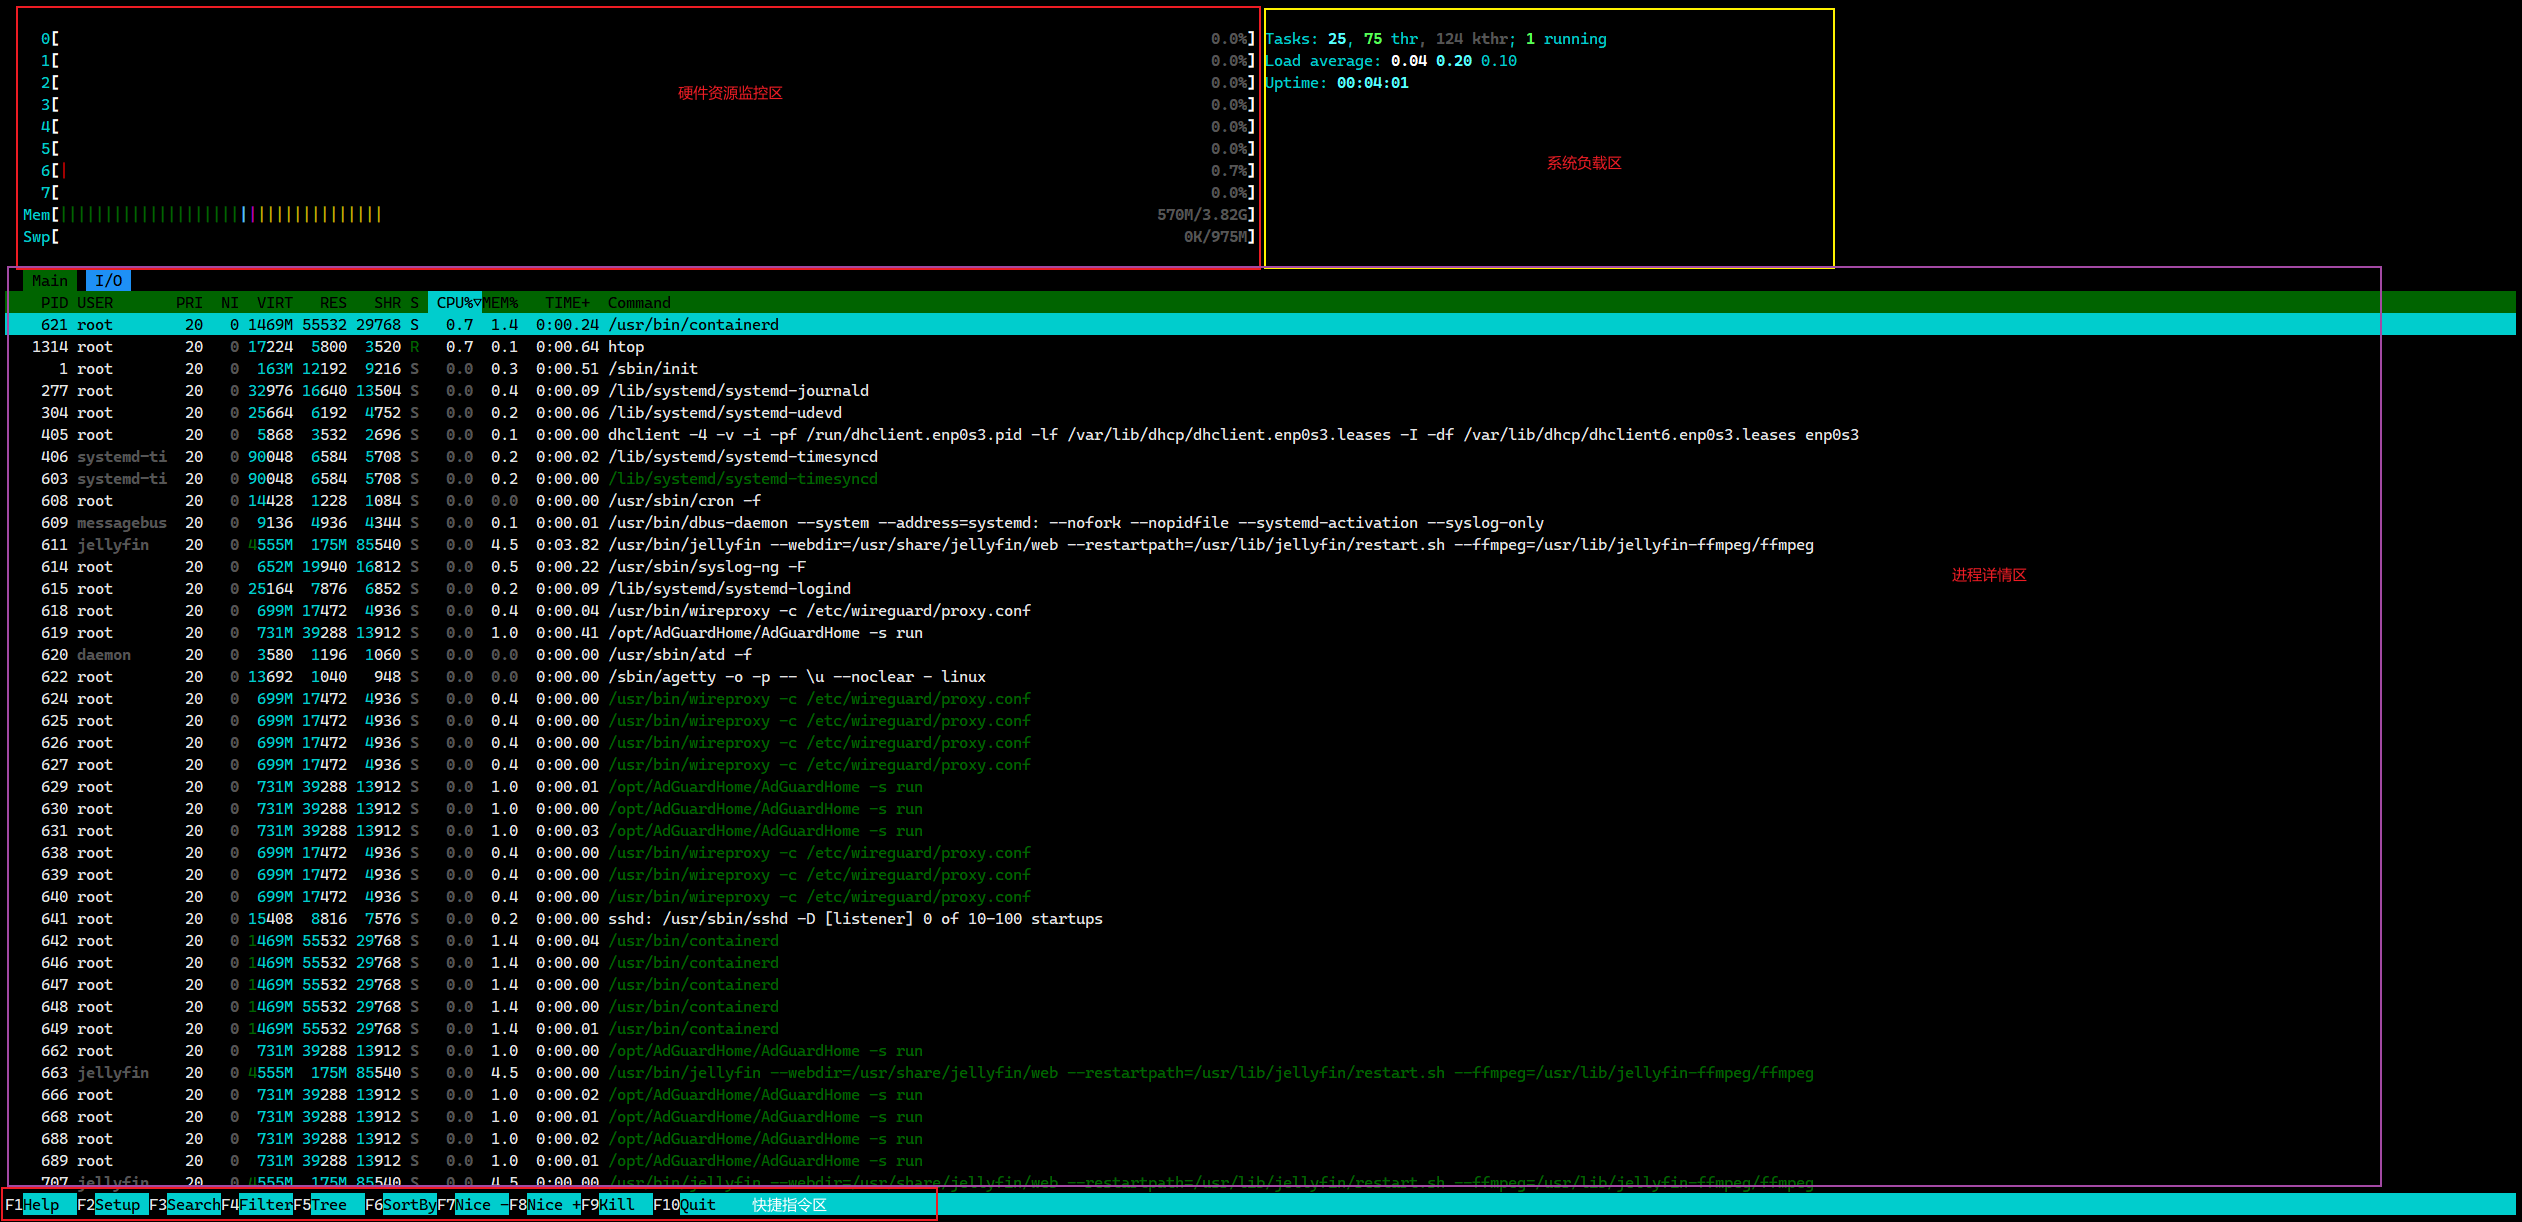
我把整个窗口分为 4 个区域:硬件资源区、系统资源区、进程管理区、快捷指令区
硬件资源区
- 通常为CPU、内存的使用情况
以图为例,可以看到有CPU 8个核心、Mem 内存 、 swap 交换内存的使用情况
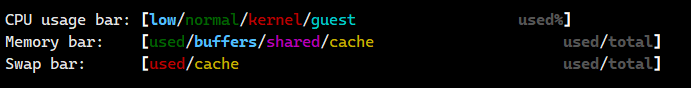
还可以设置不同的颜色代表的级别不同
系统资源区
- 通常为进程概览、uptime、Load 相关
进程管理区
- 详细的进程信息
快捷指令区
- 用于设置htop 窗口的相关信息(默认支持鼠标操作)
- F1 Help 查看使用帮助
- F2 Setup 设置
- F3 Search 搜索,仅支持 Command 字段,光标跳转到结果
- F4 Filter 过滤,仅支持 Command 字段 ,只显示过滤结果
- F5 Tree 显示进程树
- F6 SortBy 排序
- F7 Nice - 调整 Nice
- F8 Nice + 调整 Nice
- F9 Kill kill 进程
- F10 Quit 退出htop
快捷键
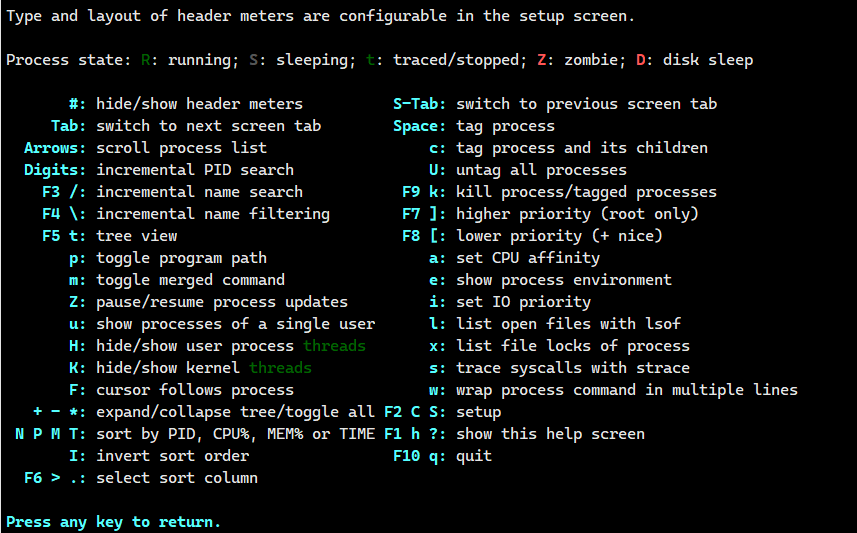
快捷键
Process state: R: running; S: sleeping; t: traced/stopped; Z: zombie; D: disk sleep
      #: 隐藏/显示标头仪表                    S-Tab: 切换到上一个屏幕选项卡
    Tab: 切换到下一个屏幕选项卡                Space: 标记进程
 Arrows: 滚动进行列表                             c: 标记进程及其子进程
 Digits: 打开PID搜索                              U: 取消所有进程标记
   F3 /: 打开进程名搜索                         F9 k: kill 选中的进行/被标记的进程(root用户执行/只kill自己名下的进程)
   F4 \: 打开进行名过滤                         F7 ]: 增加优先级 (root only)
   F5 t: 显示进行树模式                         F8 [: 减少优先级 (+ nice)
      p: 开/关进行路径显示                         a: 设置CPU亲和力
      m: 开/关合并命令                             e: 显示进程环境变量
      Z: 暂时/恢复进行更新                         i: 设置IO优先级
      u: 显示单个用户进行                          l: 使用lsof显示打开的文件
      H: 显示/隐藏用户进行线程                     x: 显示进程的文件锁
      K: 显示/隐藏内核线程                         s: 使用 strace 跟踪系统调用
      F: 光标跟随进程                              w: 多行显示进程命令
  + - *: 展开/折叠 树/开关                    F2 C S: 设置
N P M T: 按 PID,CPU% ,MEM% 或 TIME排序      F1 h ?: 显示帮助
      I: 反序                                 F10 q: 退出
 F6 > .: 选择排序列
设置
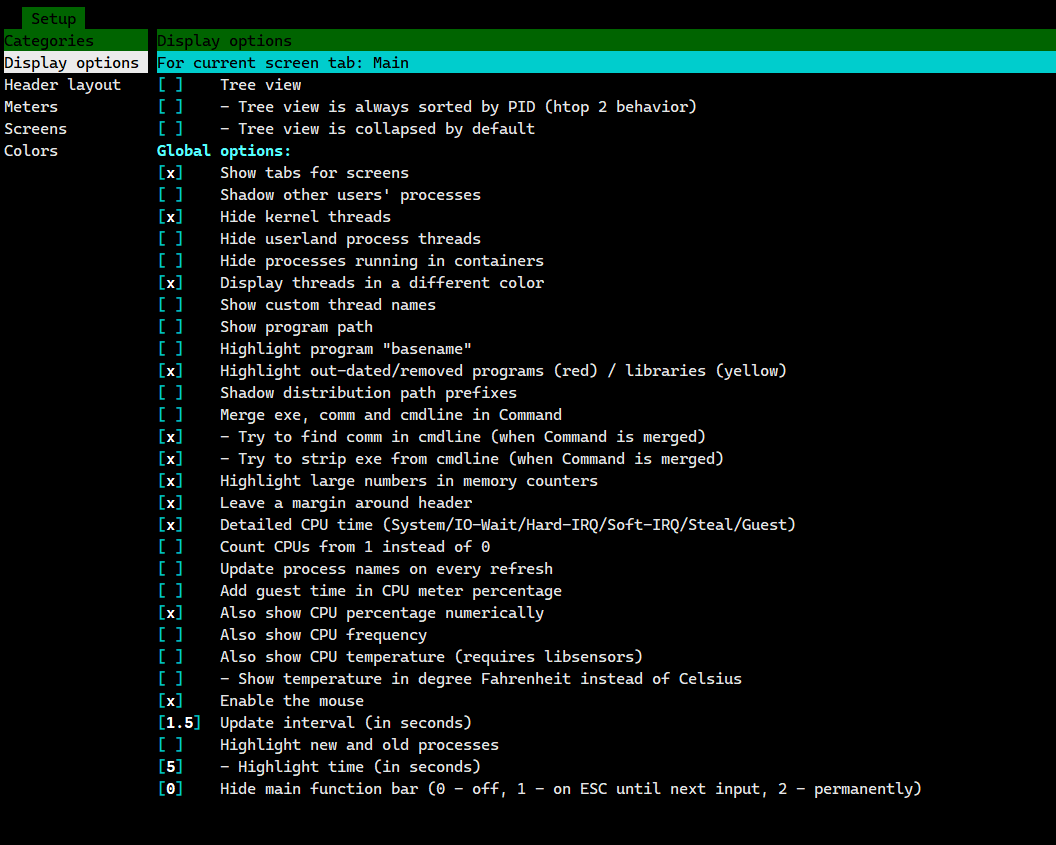
- Display options
Display 选项参数
Display options
For current screen tab: Main

[] Tree view #显示进程树
[] - Tree view is always sorted by PID (htop 2 behavior) # 树视图始终按 PID 排序(htop 2 行为)
[] - Tree view is collapsed by default # 树视图默认折叠
Global options:
[] Show tabs for screens # 显示屏幕选项卡
[] Shadow other users' processes # 阴影其他用户的进程(进程列不显示颜色)
[] Hide kernel threads # 隐藏内核线程
[] Hide userland process threads # 隐藏用户态进程线程
[] Hide processes running in containers # 隐藏容器中运行的进程
[] Display threads in a different color # 以不同的颜色显示线程
[] Show custom thread names # 显示自定义线程名称
[] Show program path # 显示程序路径
[] Highlight program "basename" # 突出显示程序“basename”
[] Highlight out-dated/removed programs (red) / libraries (yellow) # 突出显示过时/已删除的程序(红色)/库(黄色)
[] Shadow distribution path prefixes # 隐藏分发路径前缀
[] Merge exe, comm and cmdline in Command # 在 Command 中合并 exe、comm 和 cmdline
[] - Try to find comm in cmdline (when Command is merged) # 尝试在cmdline中查找comm(当命令合并时)
[] - Try to strip exe from cmdline (when Command is merged) # 尝试从cmdline中剥离exe(当命令合并时)
[] Highlight large numbers in memory counters # 高亮显示内存计数器中的大数字
[] Leave a margin around header # 在标题周围留出边距
[] Detailed CPU time (System/IO-Wait/Hard-IRQ/Soft-IRQ/Steal/Guest) # 详细的CPU时间(System/IO-Wait/Hard-IRQ/Soft-IRQ/Steal/Guest)
[] Count CPUs from 1 instead of 0 # 从 1 而不是 0 开始计算 CPU
[] Update process names on every refresh # 每次刷新时更新进程名称
[] Add guest time in CPU meter percentage # 在CPU指标百分比中添加访客时间
[] Also show CPU percentage numerically # 还以数字方式显示 CPU 百分比
[] Also show CPU frequencvy # 同时显示CPU频率
[] Also show CPU temperature (requires libsensors) # 同时显示 CPU 温度(需要 libsensors)
[] - Show temperature in degree Fahrenheit instead of Celsius # 以华氏度而不是摄氏度显示温度
[] Enable the mouse # 启用鼠标
[] Update interval (in seconds) # 更新间隔(以秒为单位)
[] Highlight new and old processes # 高亮新旧进程
[] - Highlight time (in seconds) # 高亮时间(以秒为单位)
[] Hide main function bar (0 - off, 1 - on ESC until next input, 2 - permanently) # 隐藏主功能栏(0 - 关闭,1 - 打开ESC直到下一次输入,2 - 永久)- Header layout
设置 htop 头部的布局,header 有几列,分别占比是多少
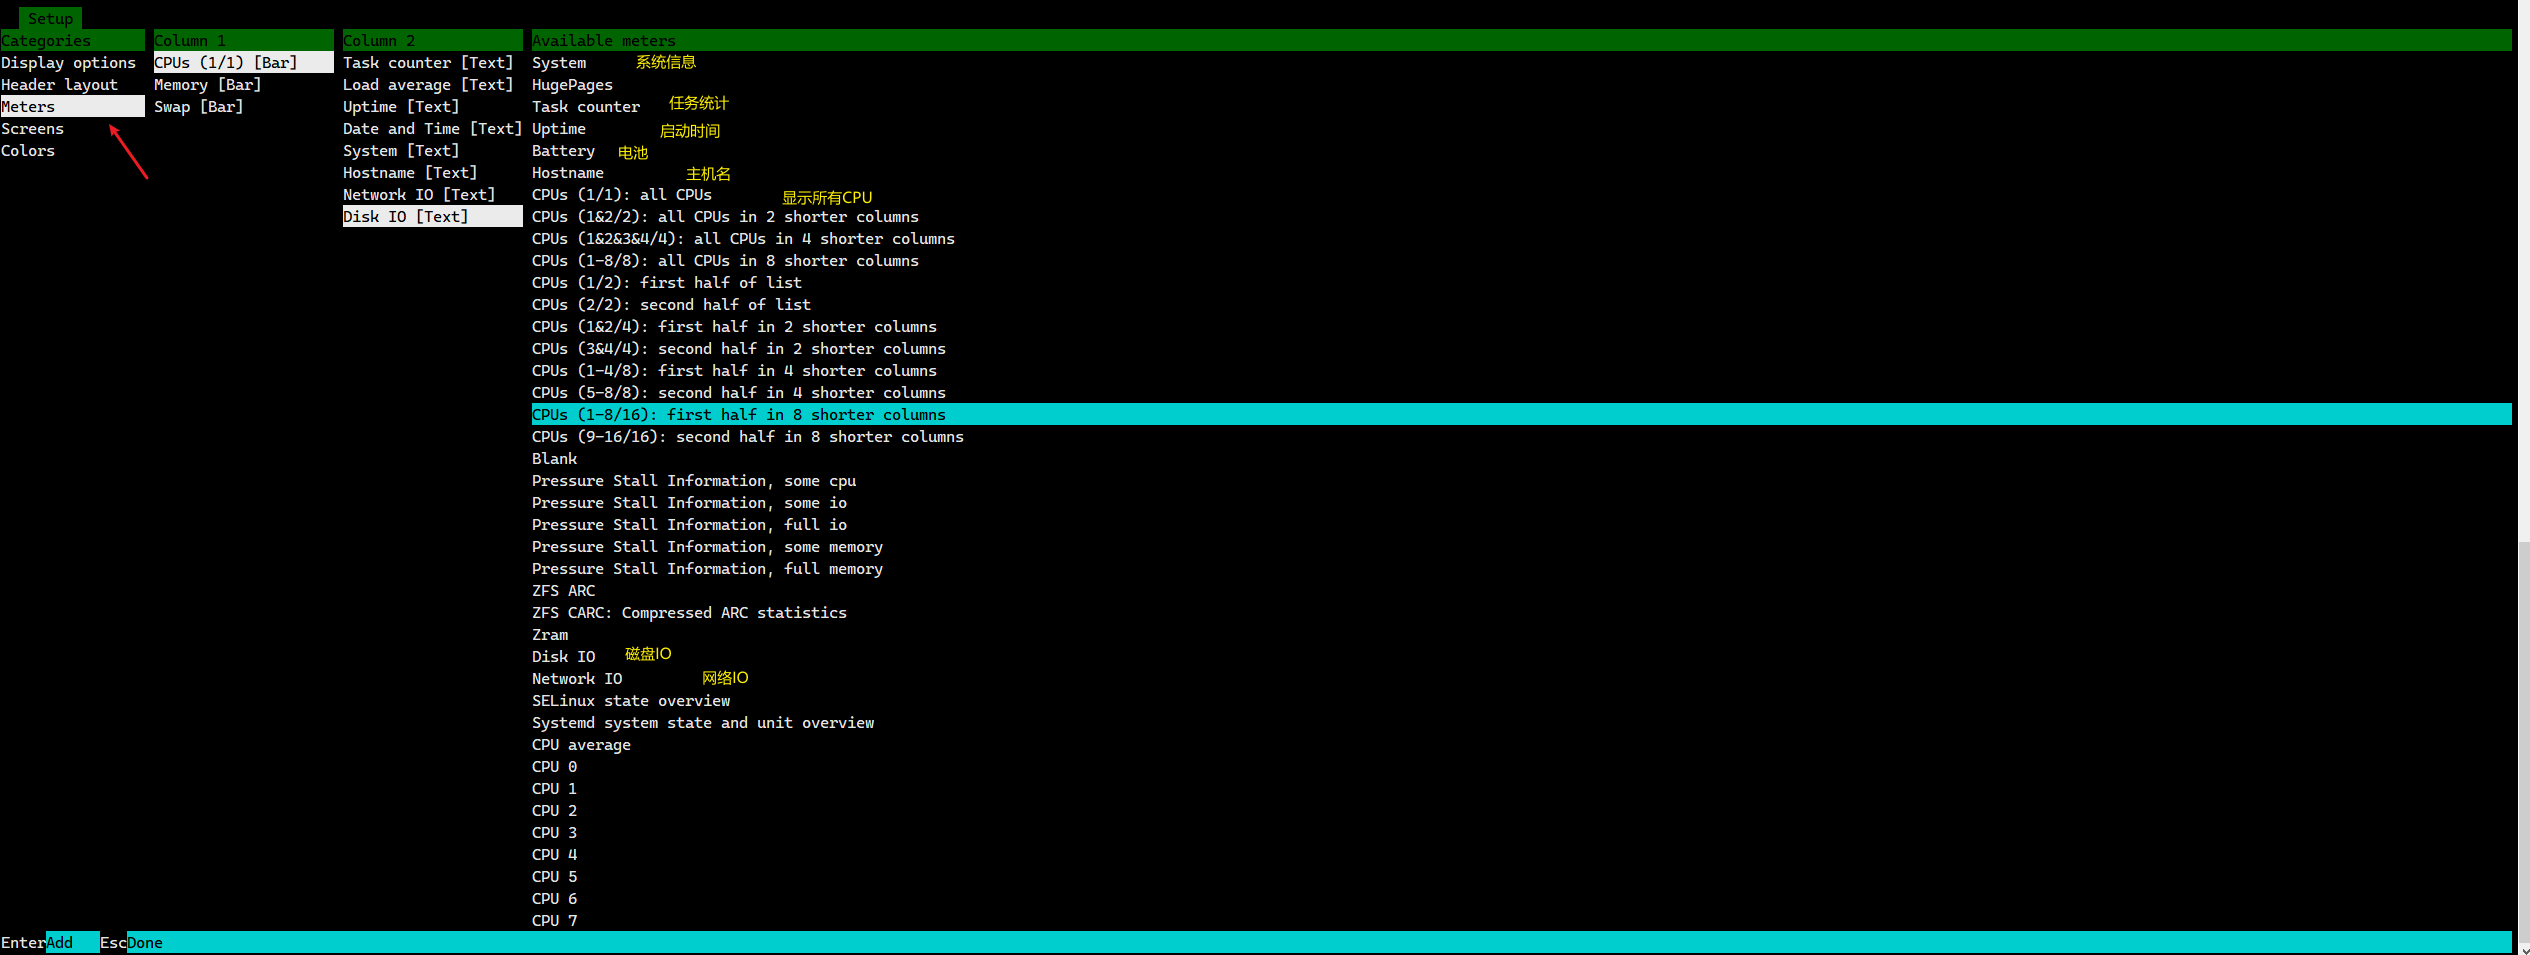
- Meters
用于对 header 添加显示的内容
每个选项都有多种显示方式
- bar(进度条)
- text(文本)
- graph(图形)
- lED(仿LED风格)
Meters 里的可选不多,基本都可以看懂,这里就不再全部记录一次了
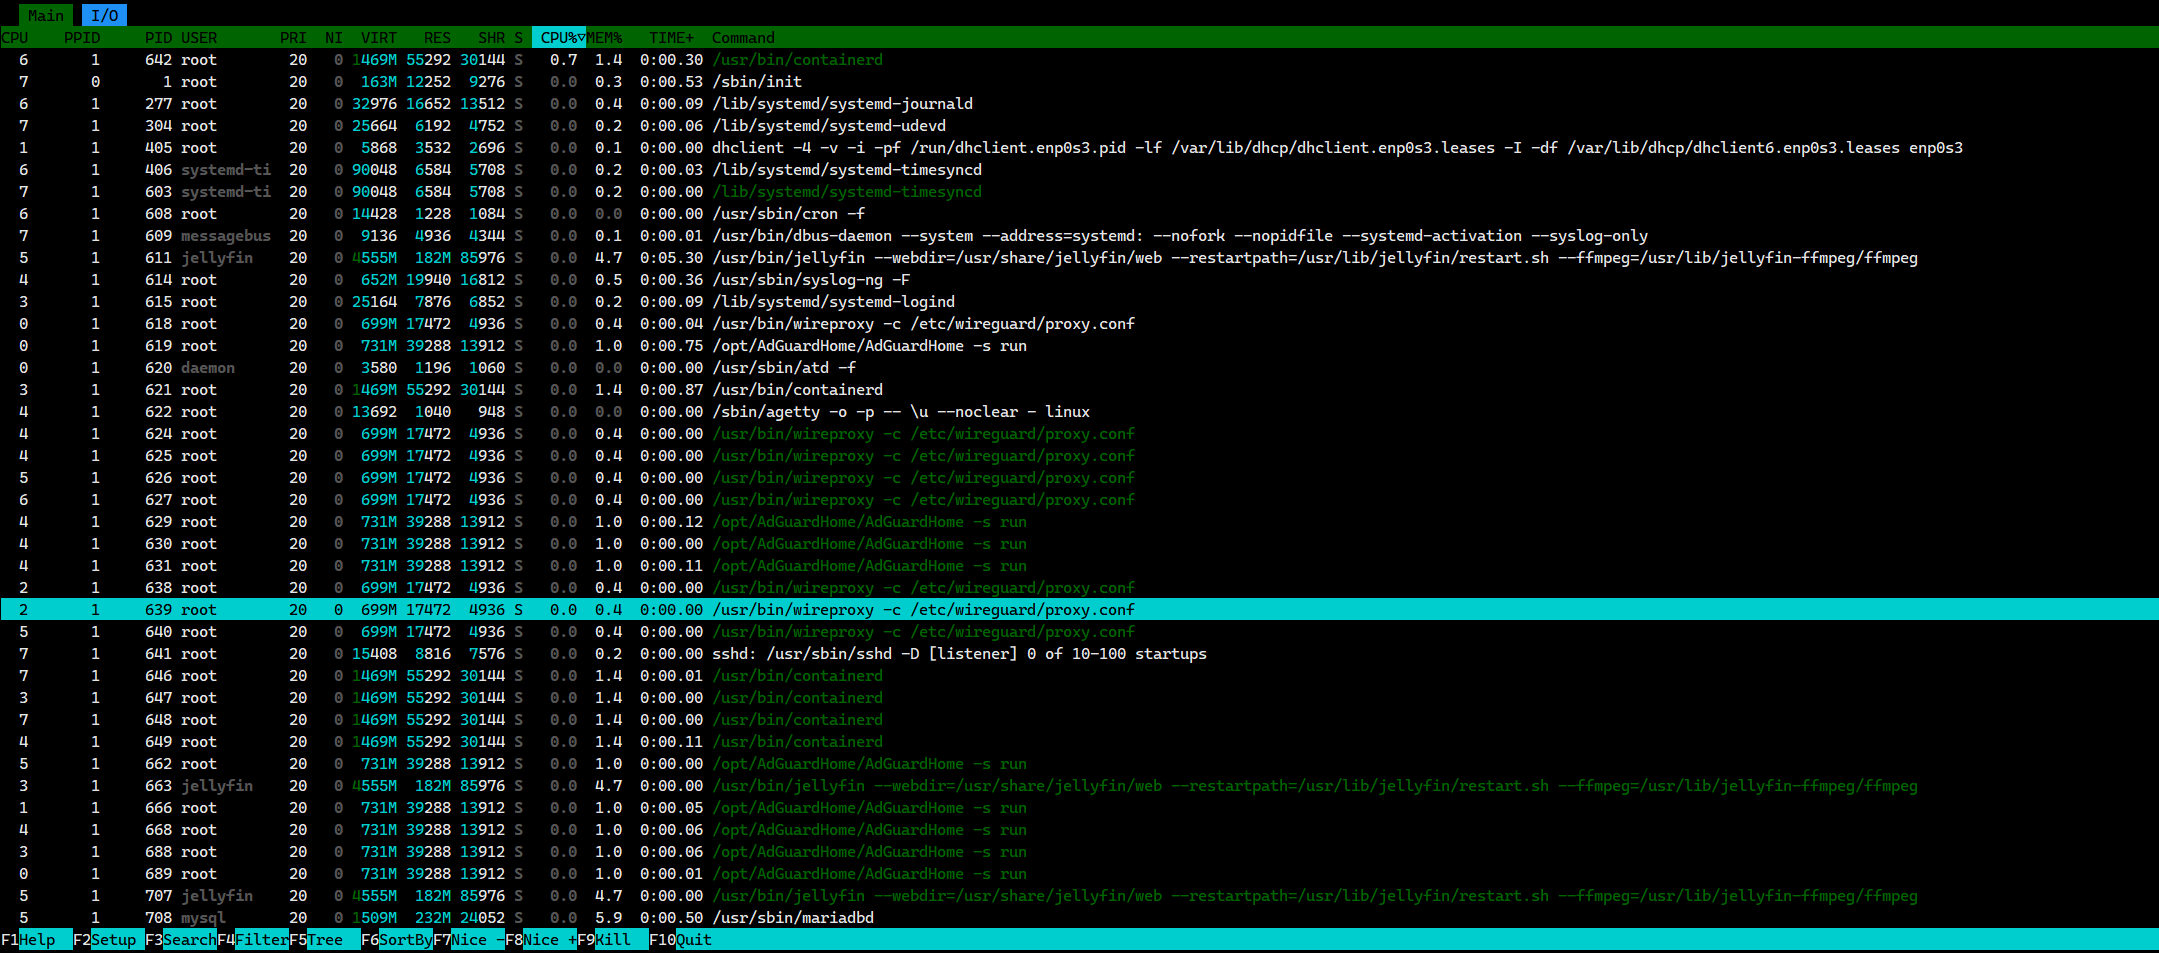
- Screens
进程区显示的列内容选项
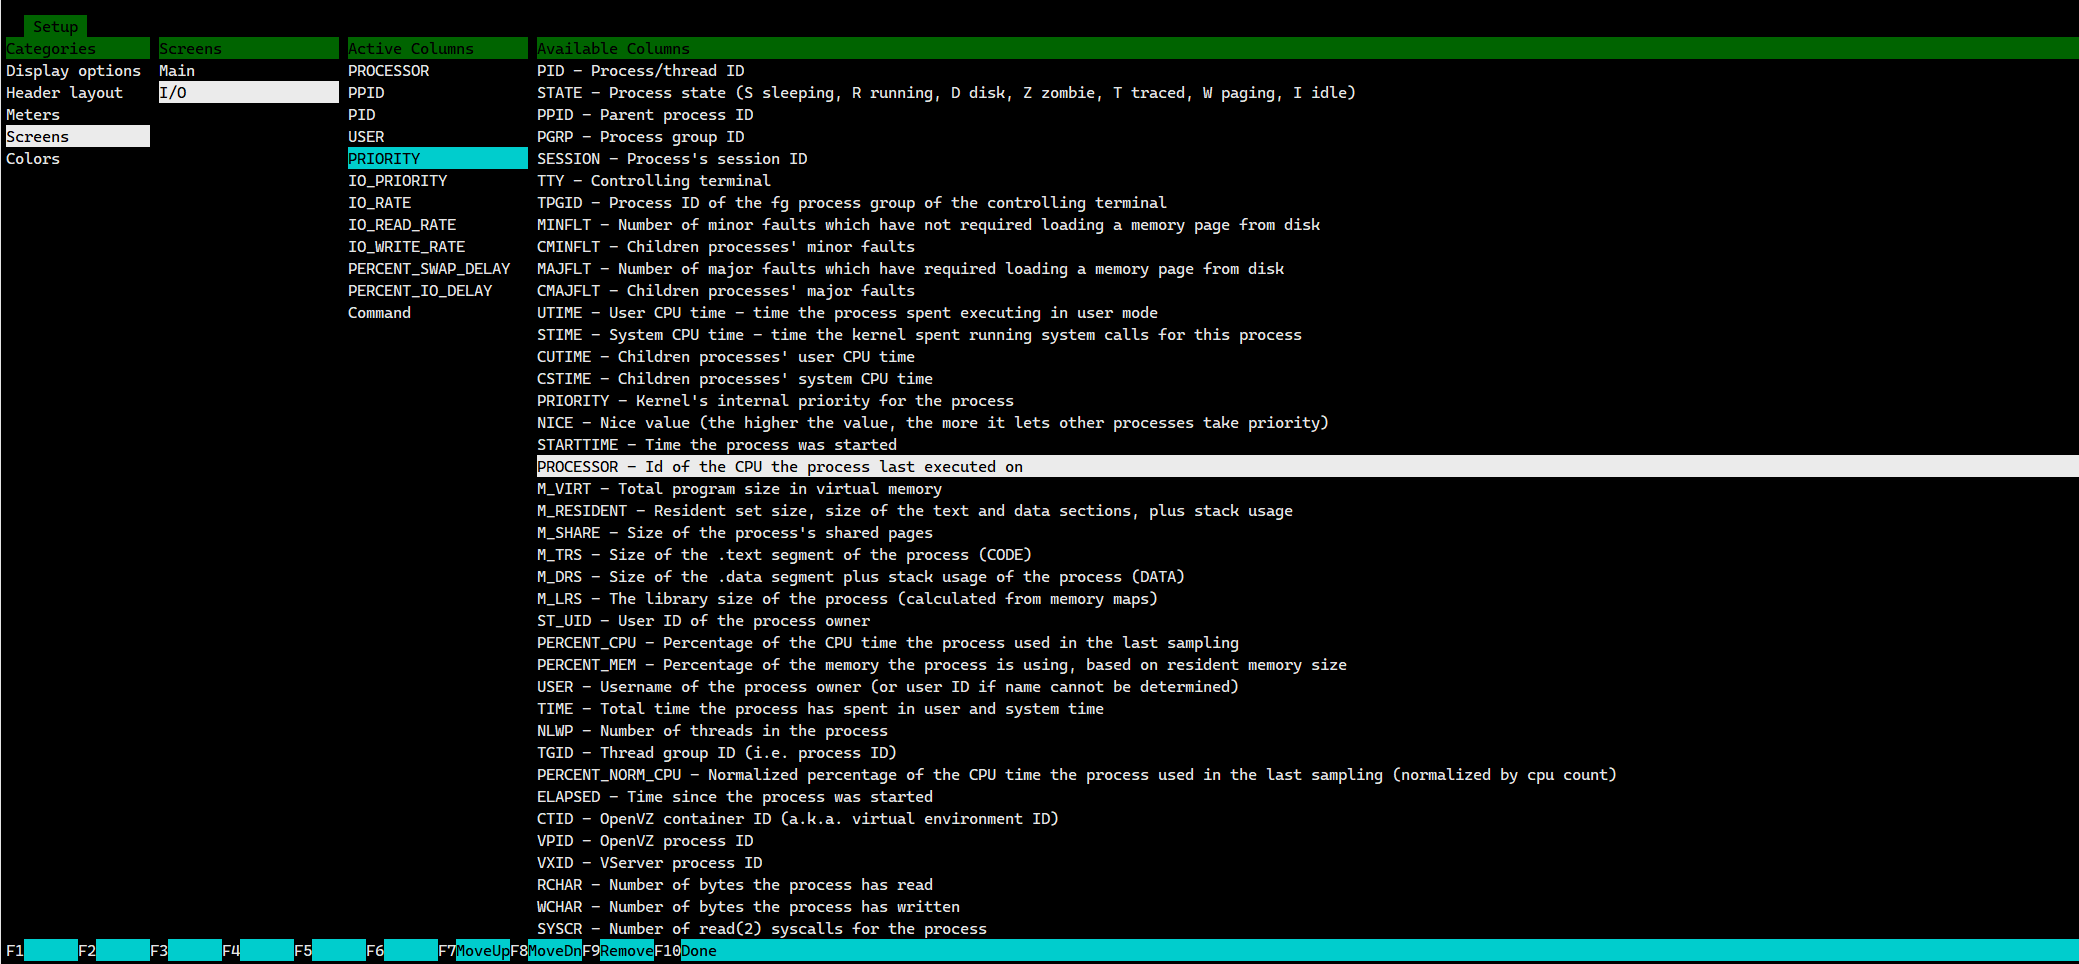
参数含义
PID - Process/thread ID
# 进程/线程 ID
STATE - Process state (S sleeping, R runing, D disk, Z zombie, T traced, W paging, I idle)
# 进程状态(S 休眠、R 运行、D 盘、Z 僵尸、T 跟踪、W 分页、I 空闲)
PPID - Parent precess ID
# 父级优先级 ID
PGRP - Process group ID
# 进程组 ID
SESSION - Process's session ID
# 进程的会话 ID
TTY - Controlling terminal
# 控制终端
TPGID - Process ID of the fg process group of the controlling terminal
# 控制终端的fg(frontpage)进程组的进程ID
MINFLT - Number of minor faults which have not required loading a memory page from disk
# 不需要从磁盘加载内存页的小故障数
CMINFLT - Children processes' minor faults
# 子进程的小故障
MAJFLT - Number of major faults which have required loading a memory page from disk
# 需要从磁盘加载内存页的主要故障数
CMAJFLT - Children processes' major faults
# 子进程的主要故障
UTIME - User CPU time - time the process spent executing in user mode
# User CPU time — 进程在用户模式下执行所花费的时间
STIME - System CPU time - time the kernel spent running system calls for this process
# System CPU time — 内核为此进程运行系统调用所花费的时间
CUTIME - Children processes' user CPU time
# 子进程的用户 CPU 时间
CSTIME - Children processes' system CPU time
# 子进程的系统 CPU 时间
PRIORITY - Kernel's internal priority for the process
# 内核对进程的内部优先级
NICE - Nice value (the higher the value, the more it lets other processes take priority)
# Nice 值(值越高,它越允许其他进程优先)
STARTTIME -  Time the process was started
# 进程开始的时间
PROCESSOR - Id of the CPU the process last executed on
# 上次执行进程的 CPU 的 ID
M_VIRT - Total program size in virtual memory
# 虚拟内存中的程序占用总的大小
M_RESIDENT - Resident set size,size of the text and data sections, plus stack usage
# 常驻集大小、文本和数据部分的大小以及堆栈使用情况
M_SHARE - Size of the process's shared pages
# 进程共享页面的大小
M_TRS - Size of the .text segment of the process(CODE)
# 进程的 .text 段的大小 (CODE)
M_DRS - Size of the .data segment plus stack usage of the process(DATA)
# .data 段的大小加上进程的堆栈使用情况 (DATA)
M_LRS - The library size of the process(calculated from memory maps)
# 进程的库大小(根据内存映射计算)
ST_UID - User ID of the process owner
# 进程所有者的用户 ID
PERCENT_CPU - Percentage of the CPU time the process used in the last sampling
# 上次采样中使用的进程的 CPU 时间百分比
PERCENT MEM - Percentage of the memory the process is using, based on resident memory size
# PERCENT MEM - 进程使用的内存百分比,基于常驻内存大小
USER - Username of the process owner (or user ID if name cannot be determined)
# USER - 进程所有者的用户名(如果无法确定用户名,则为用户 ID)
TIME - Total time the process has spent in user and system time
# TIME - 进程花费在用户和系统时间中的总时间
NLWP - Number of threads in the process
# NLWP - 进程中的线程数
TGID - Thread group ID (i.e. process ID)
# TGID - 线程组ID(即进程ID)
PERCENT_NORM_CPU - Normalized percentage of the CPU time the process used in the last sampling (normalized by cpu count)
# PERCENT_NORM_CPU - 上次采样中进程使用的 CPU 时间的标准化百分比(按 CPU 计数标准化)
ELAPSED - Time since the process was started
# ELAPSED - 自进程启动以来的时间
CTID - OpenVZ container ID (a.k.a. virtual environment ID)
# CTID - OpenVZ 容器 ID(又名虚拟环境 ID)
VPID - Openvz process ID
# VPID - Openvz 进程 ID
VXID - VServer process ID
# VXID - 虚拟服务器进程ID
RCHAR - Number of bytes the process has read
# RCHAR - 进程已读取的字节数
WCHAR - Number of bytes the process has written
# WCHAR - 进程已写入的字节数
SYSCR - Number of read (2) syscalls for the process
# SYSCR - 进程的读取 (2) 系统调用数
SYSCW - Number of write (2) syscalls for the process
# SYSCW - 进程的写入 (2) 系统调用数
RBYTES - Bytes of read (2) I/O for the process
# RBYTES - 进程 read (2) I/O 的字节数
WBYTES - Bytes of wrte(2) I/O for the process
# WBYTES - 进程 wrte(2) I/O 的字节数
CNCLWB - Bytes of cancelled write (2) I/O
# CNCLWB - 取消写入的字节 (2) I/O
IO_READ_RATE - The I/O rate of read(2) in bytes per second for the process
# IO_READ_RATE - 进程的 read(2) 的 I/O 速率(以字节每秒为单位)
IO_WRITE_RATE - The I/O rate of write (2) in bytes per second for the process
# IO_WRITE_RATE - 进程的 write (2) 的 I/O 速率(以字节每秒为单位)
IO_RATE - Total I/O rate in bytes per second
# IO_RATE - 总 I/O 速率(以字节/秒为单位)
CGROUP - Which cgroup the process is in
# CGROUP - 进程所在的 cgroup
OOM - OOM (Out-of-Memory) killer score
# OOM - OOM(内存不足)致命分数
IO_PRIORITY - I/O priority
# IO_PRIORITY - I/O 优先级
PERCENT_CPU_DELAY - CPU delay %
# PERCENT_CPU_DELAY - CPU 延迟百分比
PERCENT_IO_DELAY - Block I/O delay %
# PERCENT_IO_DELAY - 块 I/O 延迟百分比
PERCENT_SWAP_DELAY - Swapin delay %
# PERCENT_SWAP_DELAY - swap 延迟百分比
M_PSS - proportional set size, same as M_RESIDENT but each page is divided by the number of processes sharing it
# M_PSS - 比例集大小,与 M_RESIDENT 相同,但每个页面除以共享该页面的进程数量
M_SWAP - Size of the process's swapped pages
# M_SWAP - 进程交换页面的大小
M_PSSWP - shows proportional swap share of this mapping, unlike "Swap", this does not take into account swapped out page of underlying shmem objects
# M_PSSWP - 显示此映射的成比例交换份额,与“Swap”不同,这不考虑基础 shmem 对象的换出页面
CTXT - Context switches (incremental sum of voluntary_ctxt_switches and nonvoluntary_ctxt_switches)
# CTXT - 上下文切换(volunter_ctxt_switches 和 nonvolunter_ctxt_switches 的增量总和)
SECATTR - Security attribute of the process (e.g. SELinux or AppArmor)
# SECATTR - 进程的安全属性(例如 SELinux 或 AppArmor)
COMM - comm string of the process from /proc/[pid]/comm
# COMM - 来自 /proc/[pid]/comm 的进程的通信字符串
EXE - Basename of exe of the process from proc/[pid]/exe
# EXE - proc/[pid]/exe 中进程的 exe 的基本名称
CWD - The current working directory of the process
# CWD - 进程的当前工作目录
AUTOGROUP_ID - The autogroup identifier of the process
# AUTOGROUP_ID - 进程的自动组标识符
AUTOGROUP NICE - Nice value (the higher the value, the more other processes take priority) associated with the process autogroup
# AUTOGROUP NICE - 与进程自动组关联的良好值(值越高,其他进程越优先)
CCGROUP - Which group the process is in condensed to essentials)
# CCGROUP - 该过程属于哪个组,浓缩为要点)- Colors
颜色选项,类似主题
实操指南
- 排序: N、P、M、T、I、F6 等快键都可使用
- 查找指定进程,F3,F4
- 杀进程,F3,F4 查找 到进行,c 标记,F9 kill ,F9并不会直接kill 而是给进行发送一个信号,信号的不同带来的效果也不同
- 只查看某一用户的进程 htop -u username ,或者 htop 后,u 进行用户选择
- 进程动态刷新影响观察,可以使用 Z 暂停刷新